SwiftUI-Data-Visualization
Statistical, financial and live charts for SwiftUI on iOS and macOS, built on Swift Charts.
License: MIT
A dependency-free Swift package with ten chart views — time series, histogram, box plot, scatter with trend line, candlestick, waterfall, heatmap, radar, treemap and live ticker — and the public analysis types behind them: Histogram, BoxPlotSummary, LinearRegression, MovingAverage, NiceScale, TreemapLayout and Largest-Triangle-Three-Buckets downsampling. Inputs that are not finite are left out and extreme values are drawn at a documented limit, and the test suite renders every chart with these extreme inputs.
Features
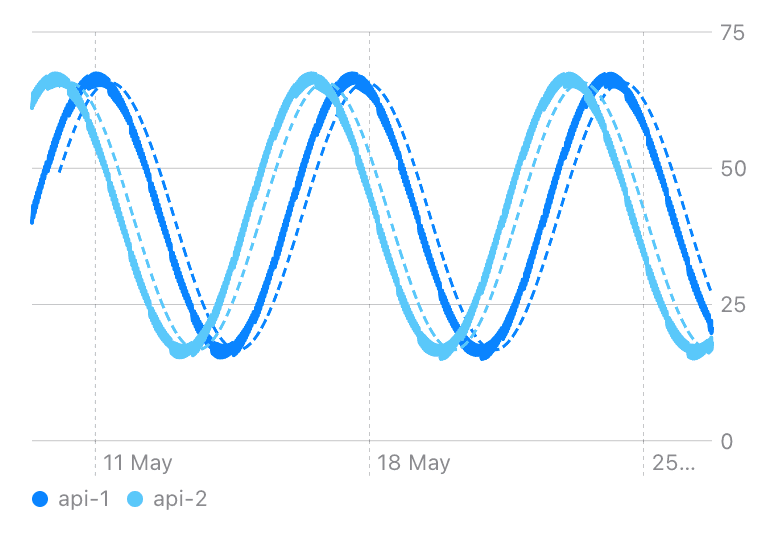
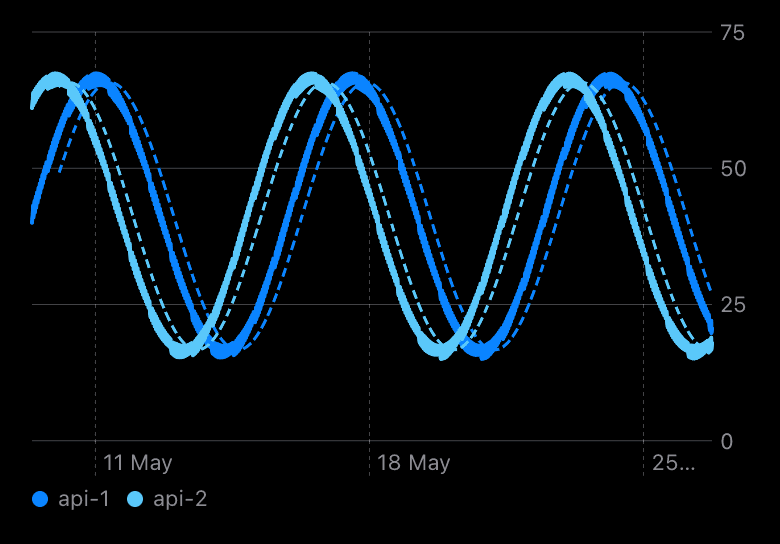
- TimeSeriesChart downsamples each series to 1,000 points with LTTB, draws moving averages, scrolls through a visible time window and reports the selected date
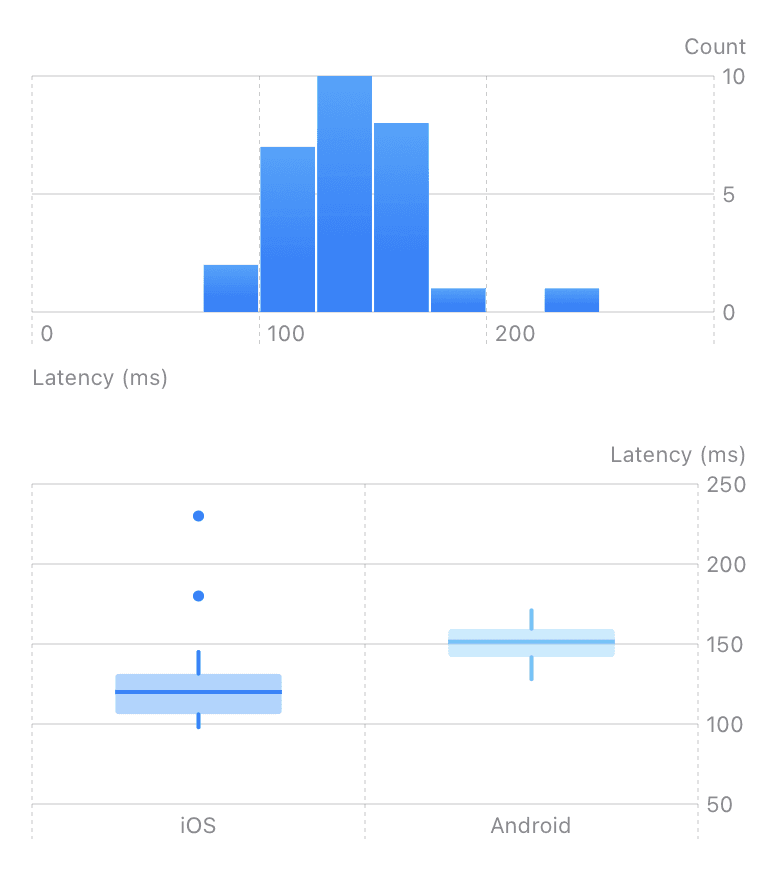
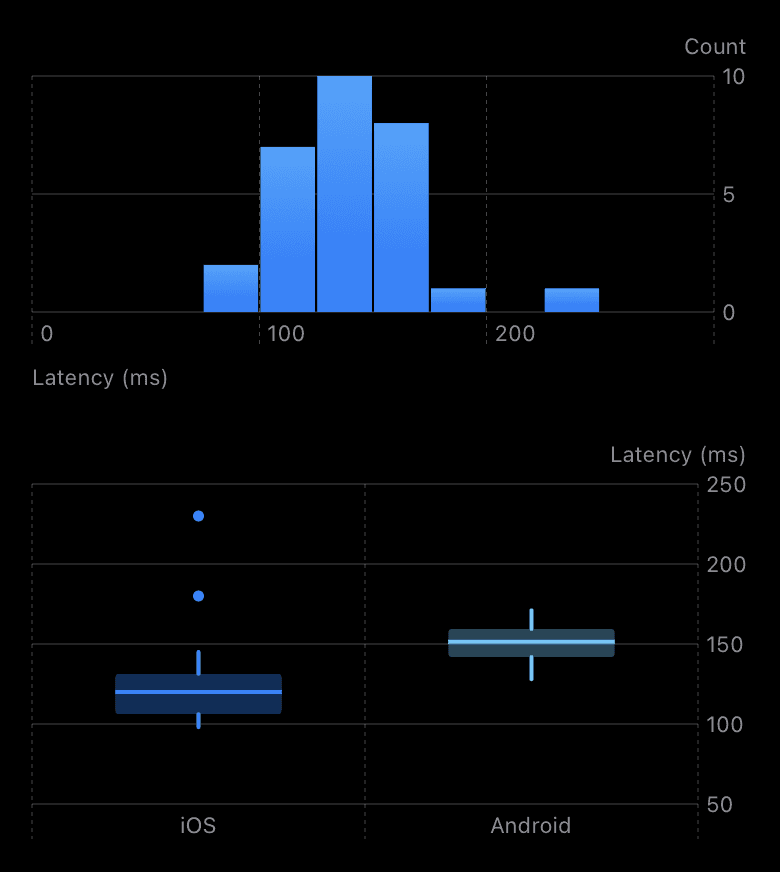
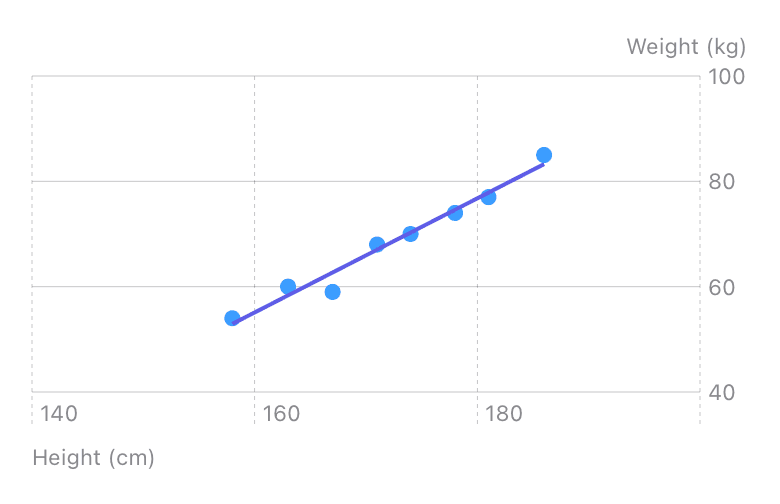
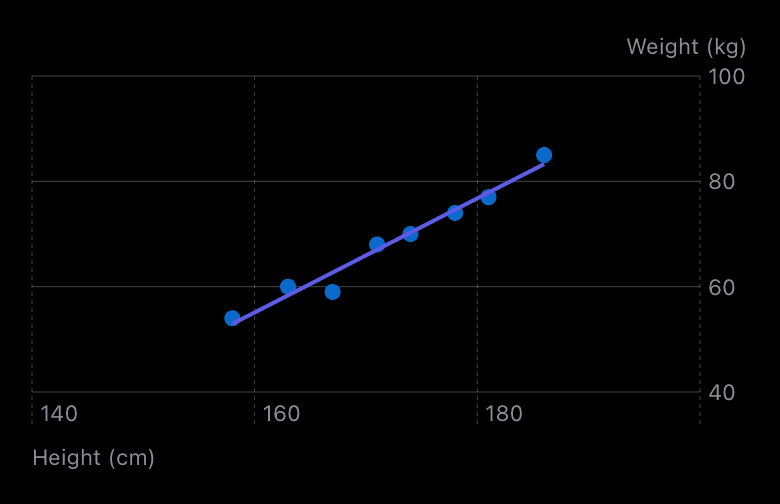
- Statistics charts: HistogramChart (Sturges, Freedman–Diaconis, fixed width or count), BoxPlotChart with Tukey whiskers, ScatterChart with a least-squares trend line
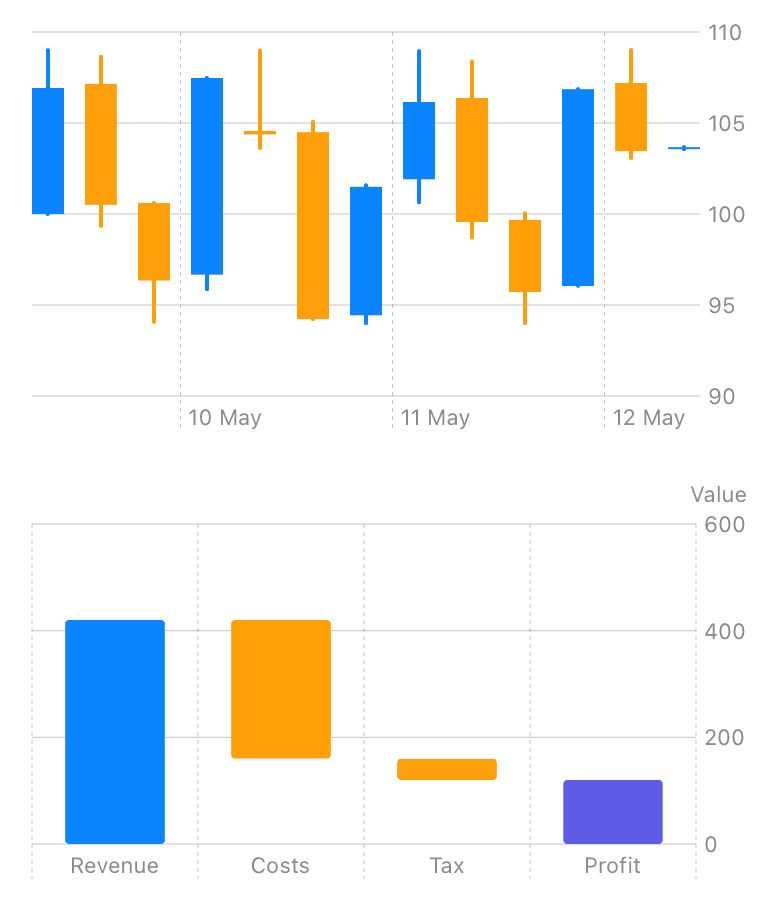
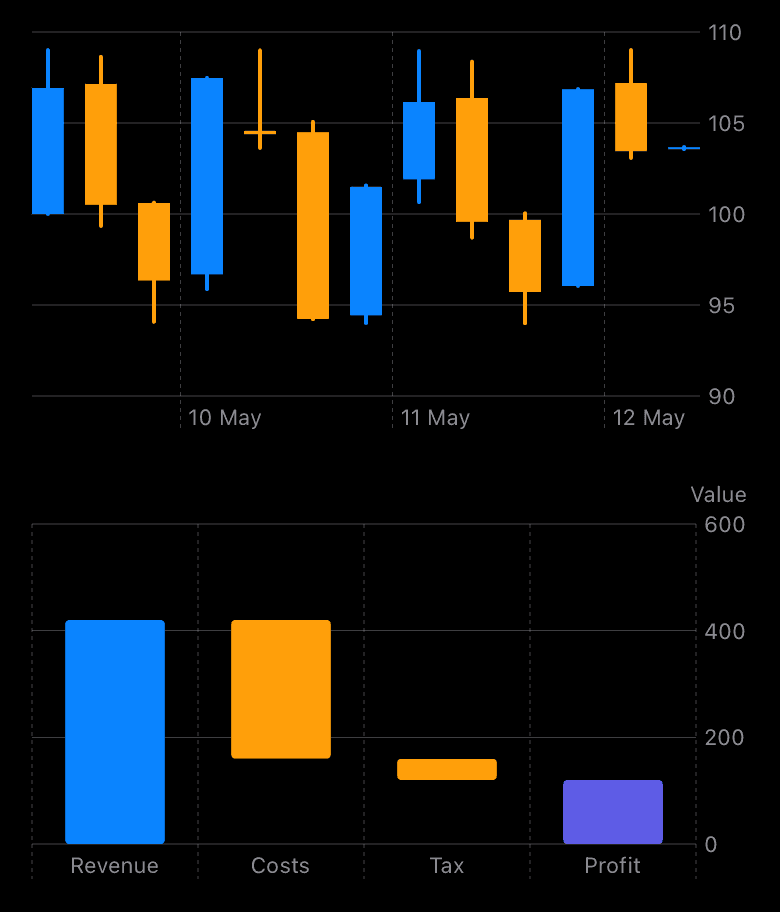
- Finance charts: CandlestickChart with Candle.aggregate(_:interval:) and WaterfallChart with totals
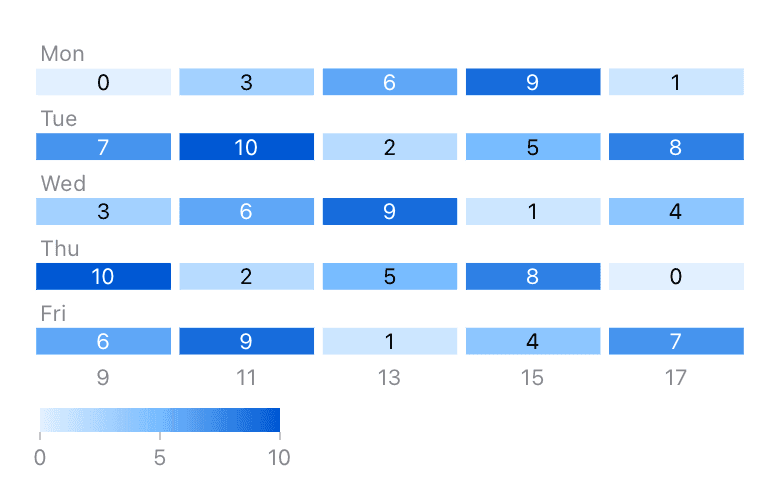
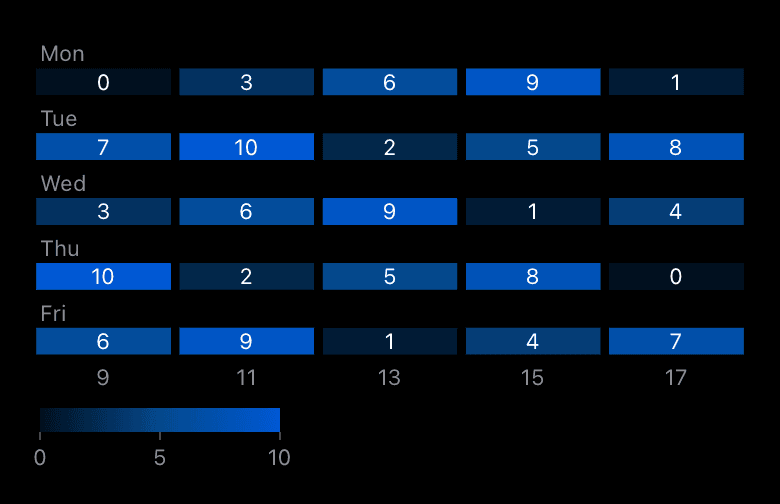
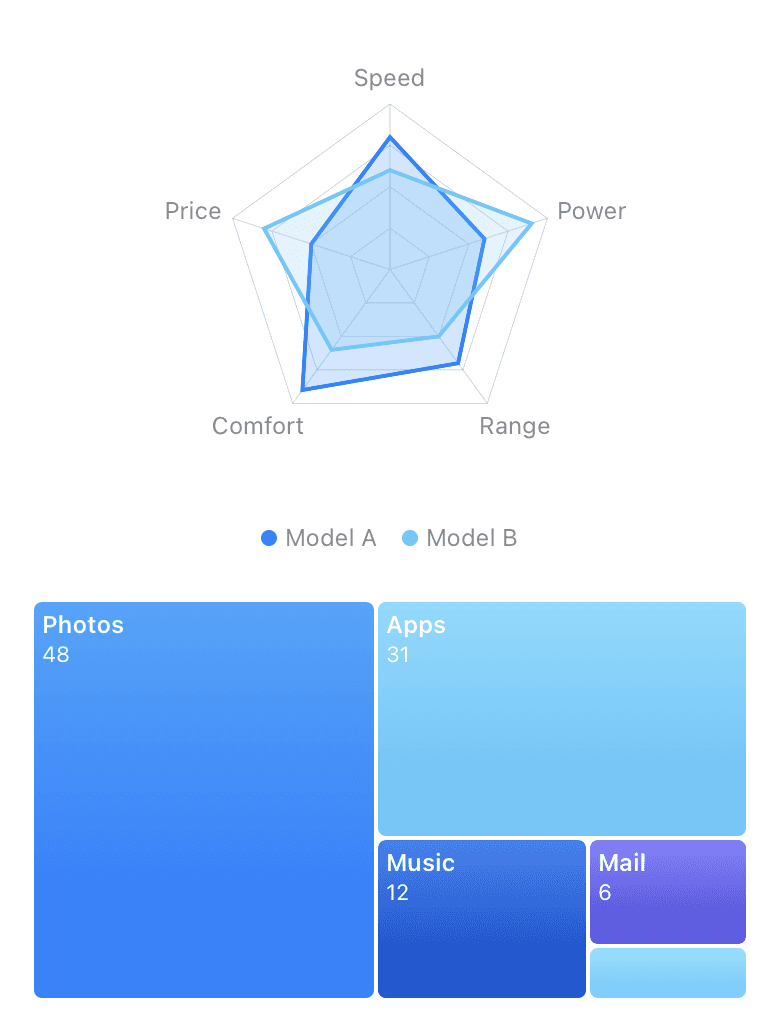
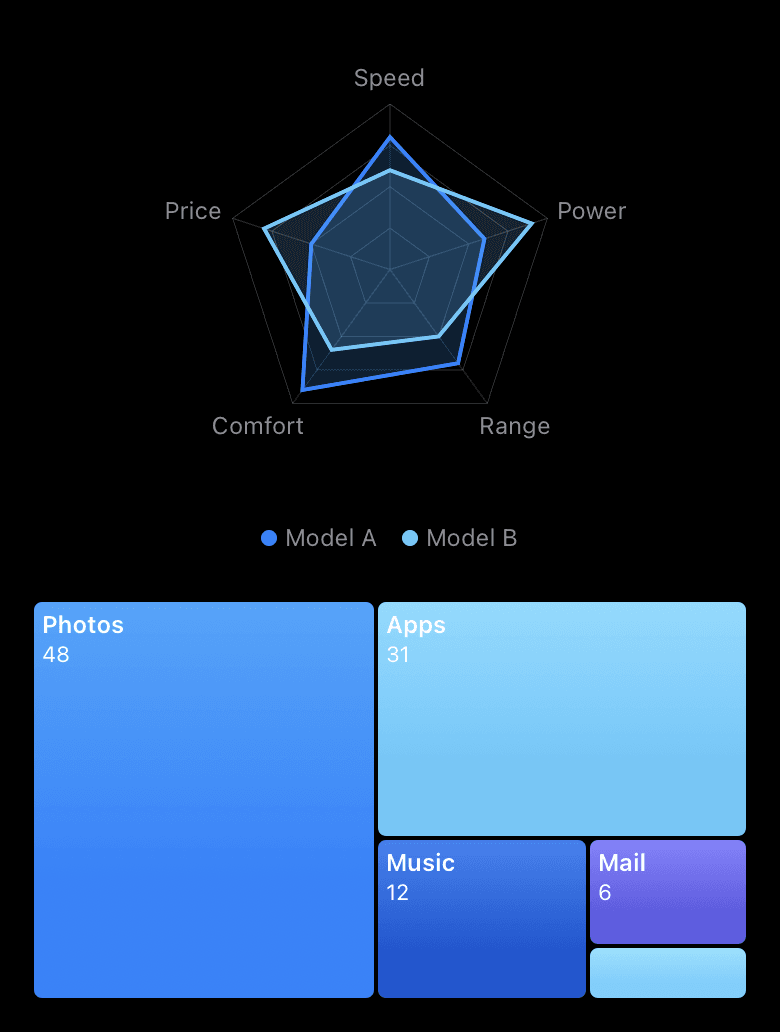
- HeatmapChart, RadarChart and a squarified TreemapChart; radar and ticker draw with Canvas, treemap with plain SwiftUI views; all three attach an AudioGraphDescriptor for VoiceOver
- Live data with RingBuffer and the observable LiveSeries feeding LiveTickerChart
- The analysis is public and Sendable, so it can be used in a Chart of your own or off the main actor
- Palettes set through .chartPalette(_:), including a color-blind safe palette; ChartExport renders a chart to PNG data or a CGImage
- A test suite that feeds nan, infinity, Int.max, extreme ranges and extreme dates to the analysis types and renders every chart with them
Quickstart
1import SwiftUI2import SwiftUIDataVisualization3 4struct ContentView: View {5 let steps = TimeSeries(6 name: "Steps",7 values: [4_200, 8_100, 6_900, 10_400, 7_800, 12_100, 9_300],8 start: .now.addingTimeInterval(-6 * 86_400),9 interval: 86_40010 )11 12 var body: some View {13 TimeSeriesChart(steps)14 .frame(height: 240)15 .padding()16 }17}Installation
Swift Package Manager
1dependencies: [2 .package(url: "https://github.com/muhittincamdali/SwiftUI-Data-Visualization.git", from: "2.0.0")3],4targets: [5 .target(name: "YourApp", dependencies: [6 .product(name: "SwiftUIDataVisualization", package: "SwiftUI-Data-Visualization")7 ])8]Xcode
1https://github.com/muhittincamdali/SwiftUI-Data-Visualization.gitScreenshots
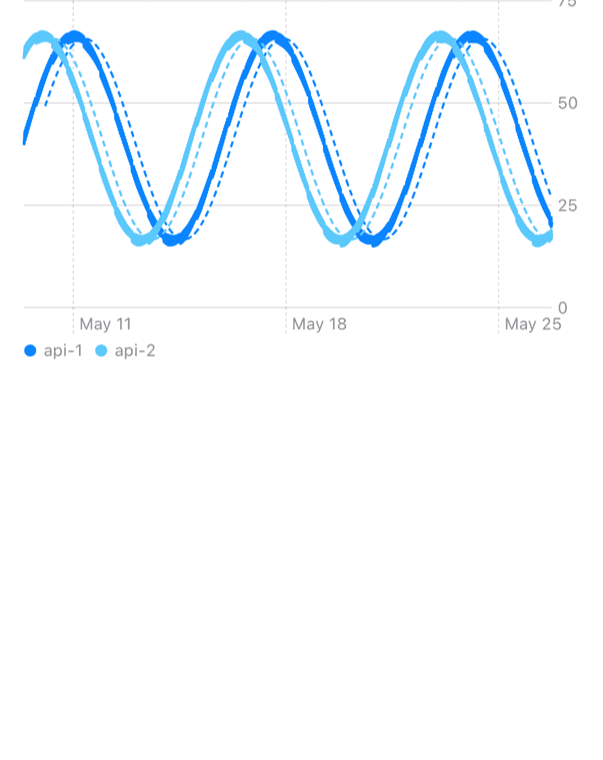
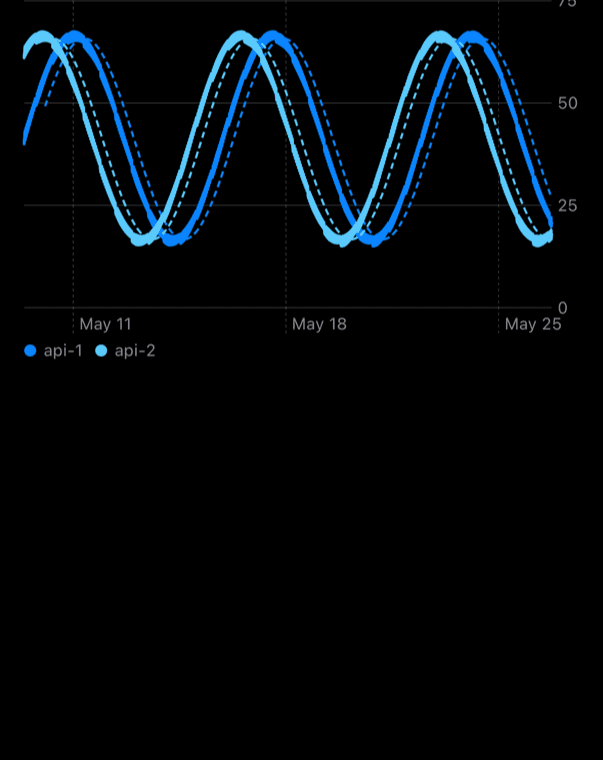


Timeline
Repository opened with bar, pie, scatter and candlestick views
Version 1.0.0 released; its sources did not build with current Xcode versions
Legacy modules removed and the package reduced to a small placeholder
Rebuilt on Swift Charts as 2.0.0, bringing in the tested algorithms and charts of SwiftUI-Charts-Pro, which was archived
2.0.1: extreme finite values clamped before Swift Charts, every same-date candle drawn